QGIS FTW!
What is QGIS?
QGIS (previously known as “Quantum GIS”) is a cross-platform free and open-source desktop geographic information systems (GIS) application that provides data viewing, editing, and analysis capabilities.
Licensed under the GNU General Public License
QGIS allows you to make maps and more…
QGIS is a powerful software application that allows you to work with Geospatial data (create, read, update, and delete), create maps, visualize data, and perform rich Geospatial analysis. Below are some examples:
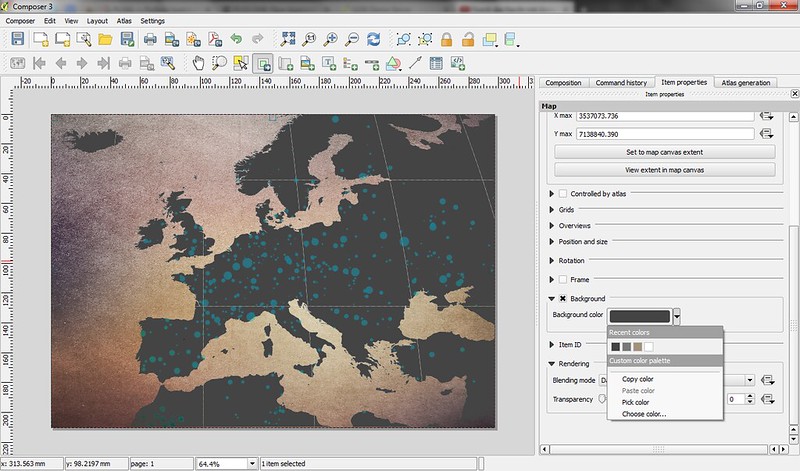
Map Cartography

Infographics
 Source: Flickr
QGIS is a Geospatial Swiss Army Knife
QGIS is a very powerful software application. With that said the product is very feature rich and is built for GIS users.

Knowing the basics of GIS will be helpful to get started If you are new to GIS I would recommend grabbing a fresh cup of coffee and reading Tom MacWright’s MapSchool. It is an EXCELLANT read to help you better understand the basics of GIS and cartography.
QGIS Components
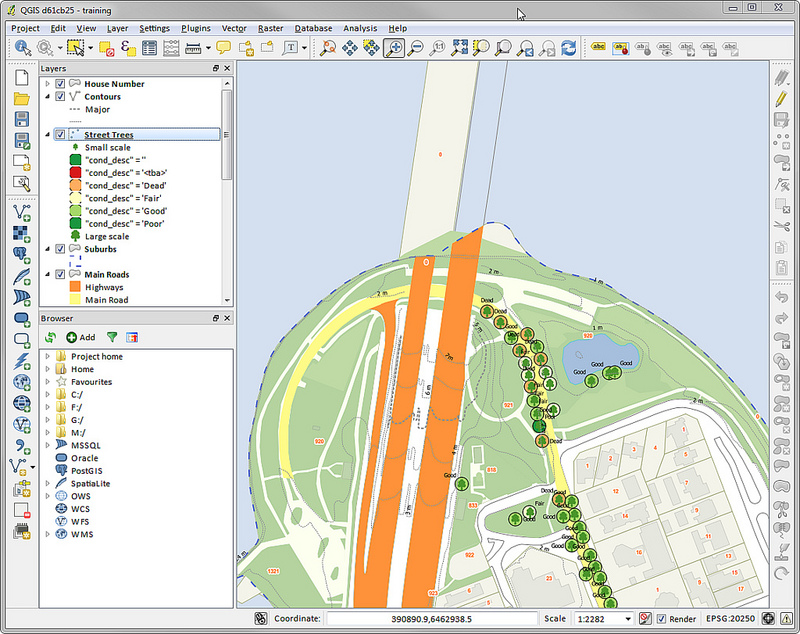
QGIS Desktop
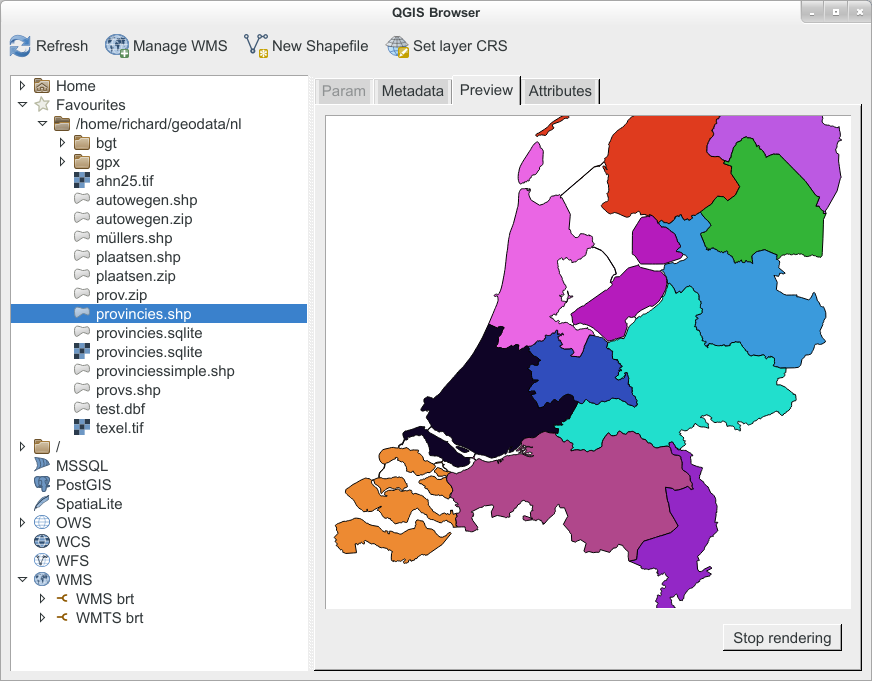
QGIS Browser
QGIS Server
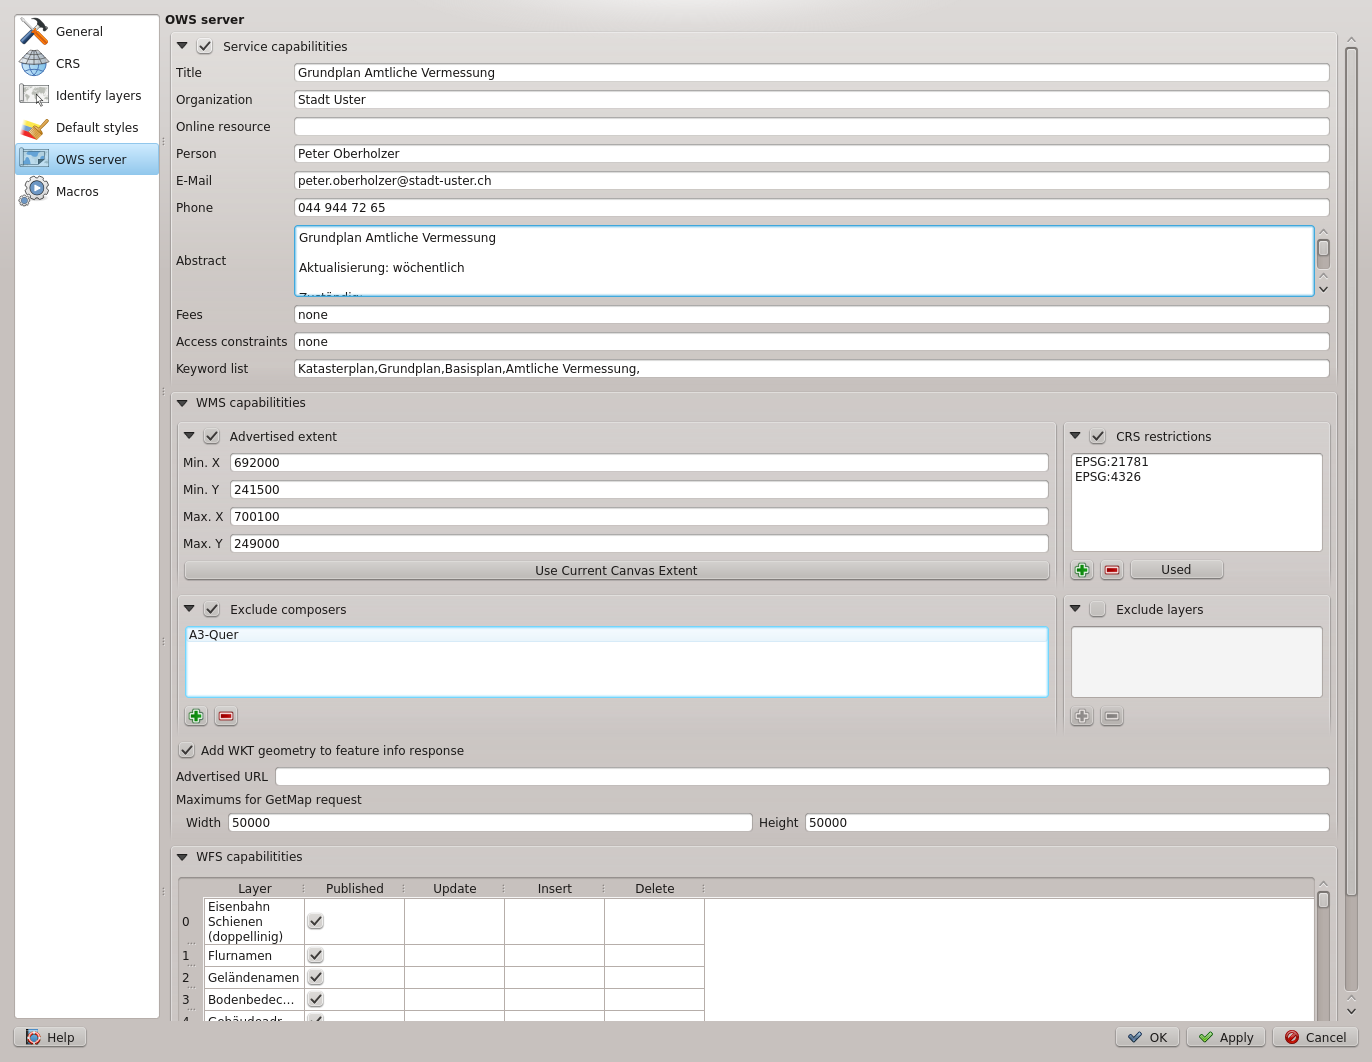
BETA QGIS Server
For this talk today we are going to focus on using the QGIS Desktop application.
Getting Started
To install QGIS go to the home page and click on the “Download Now” button.

NOTE: The file download is around 500 MB.
Once you have installed QGIS you should now have a fancy new application installed under Application or Program Files that awaits your mapping needs.

Boundless QGIS Installers
As Andy pointed out in the meetup announcement, another install route is to use the Boundless’s QGIS installers. Although their release is a couple versions behind the latest QGIS build, they include everything you’ll need to get started. Their site also requires you to enter your email address, and then they’ll email you a link to the installers. For your convenience, I’ve done that already and have linked directly to the ZIP archives here:
Windows installer: Download
Mac installer: Download
QGIS Application - UI
Let’s get familiar with the UI
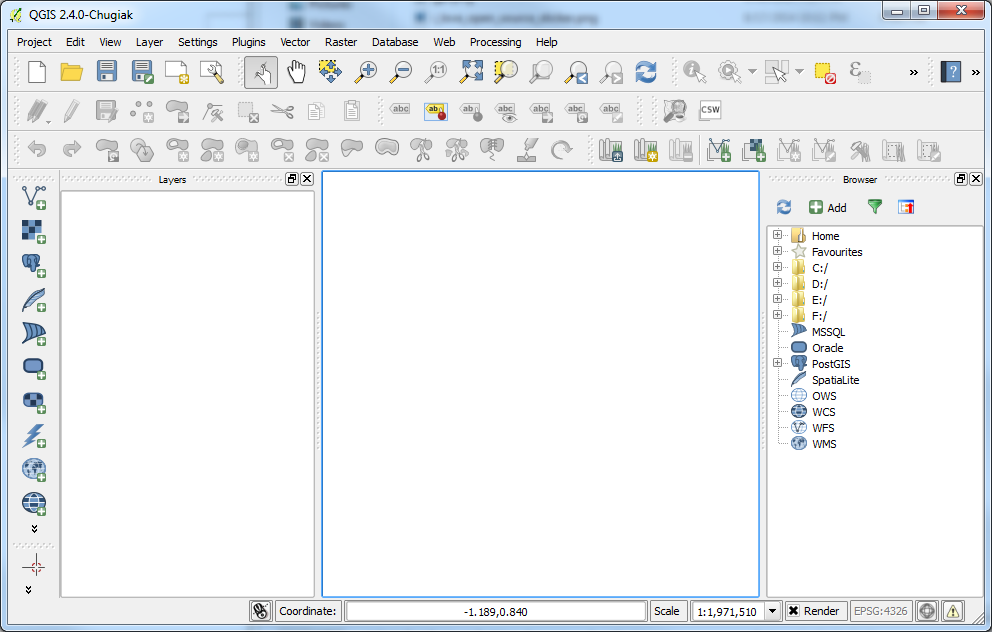
Main UI
When you first launch QGIS the application should looks similar to the screenshot below:
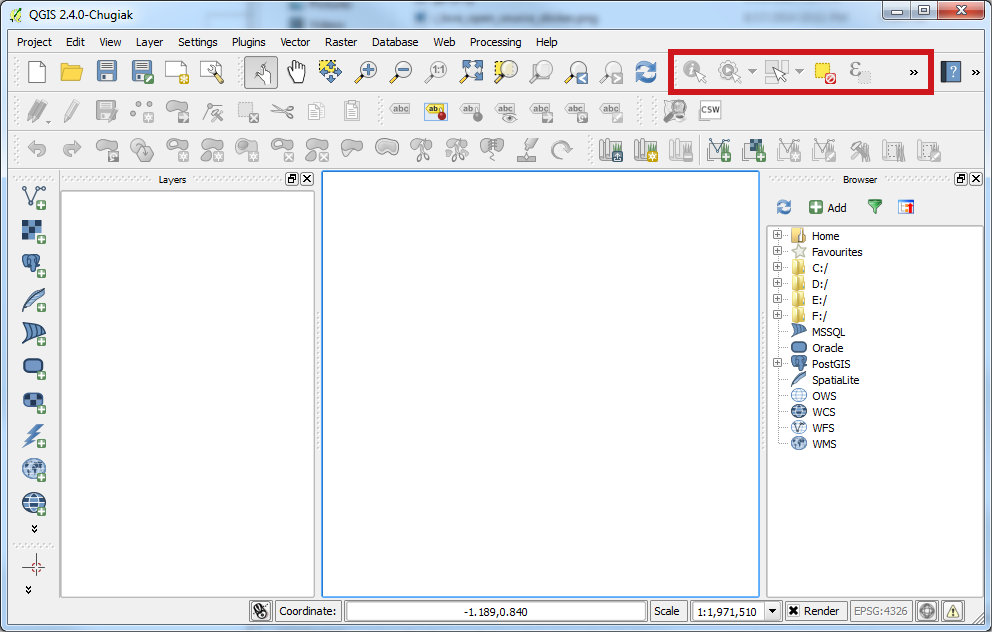
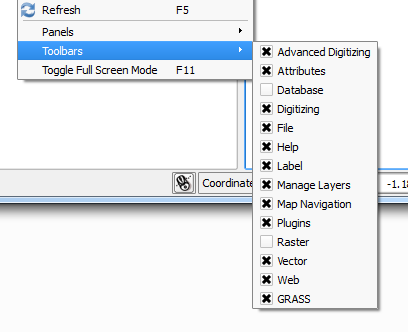
Map Navigation
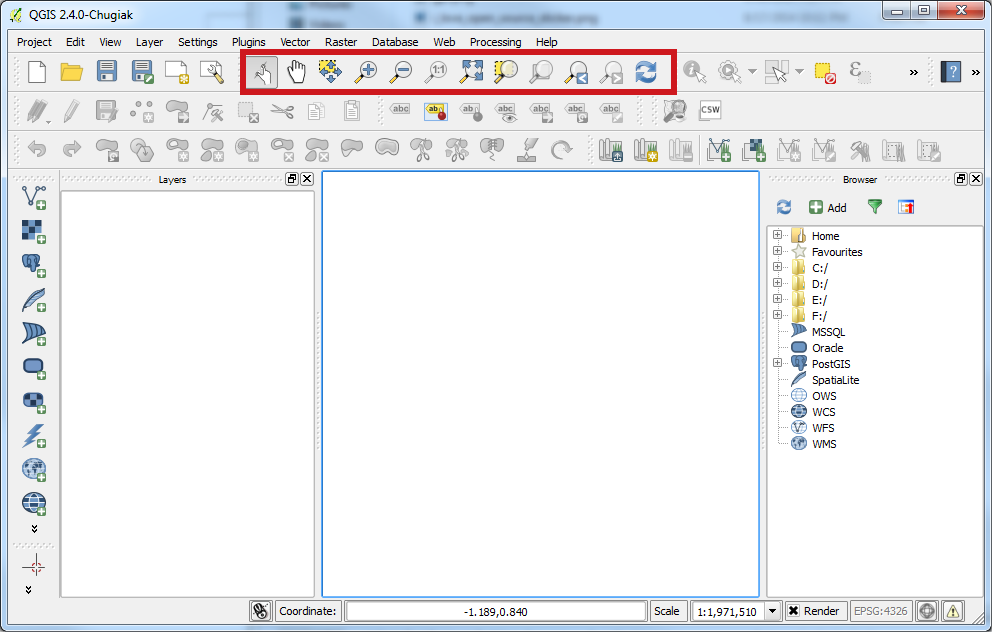
The Map Navigation tools can be accessed using the top set of tools. These tools allow you to zoom, pan, etc.
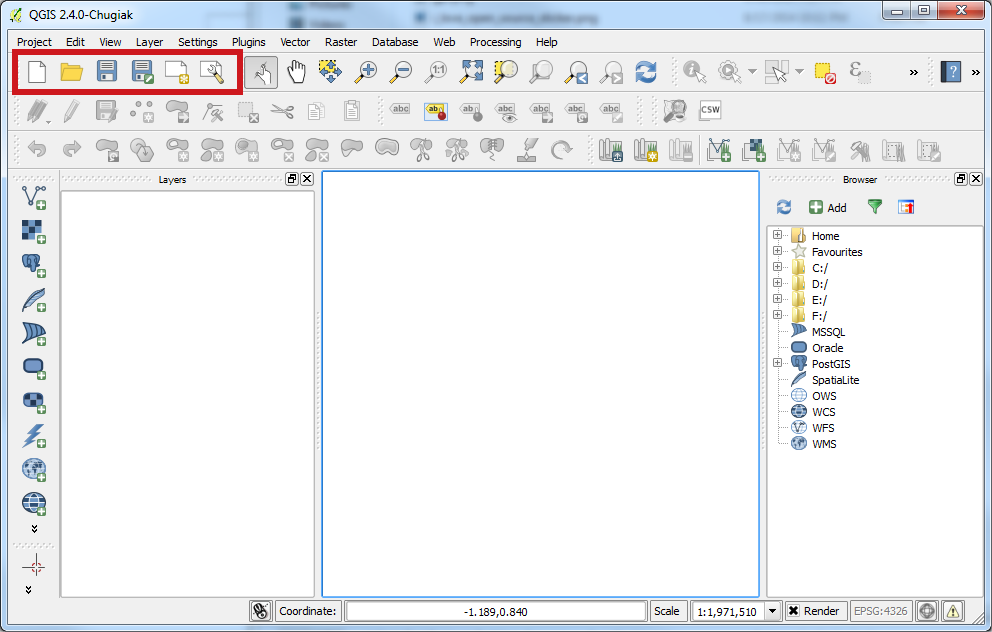
File Toolbar
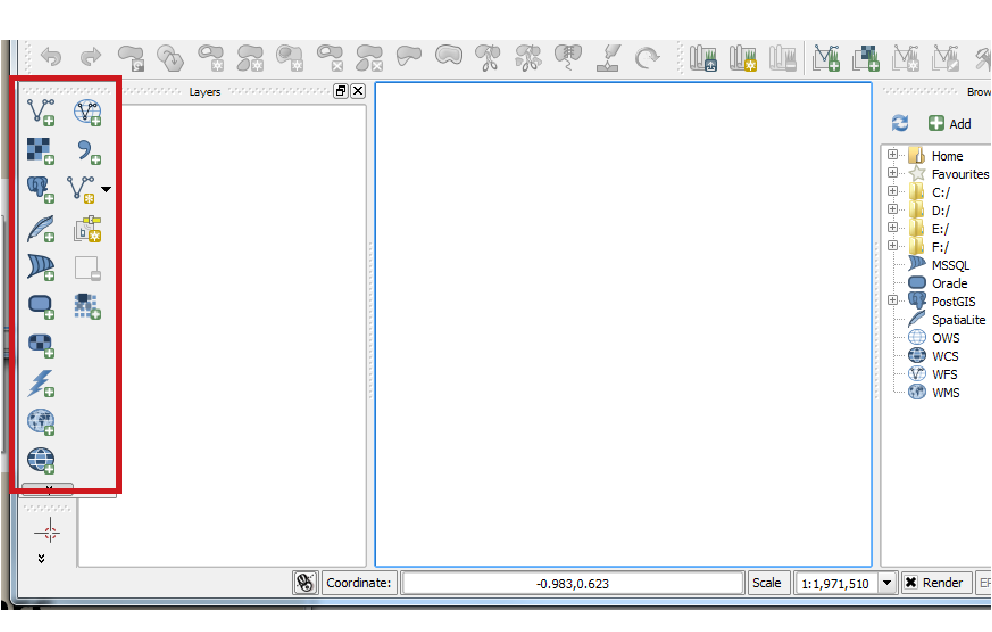
Manage Layers
Attributes Toolbar
Layers Panel
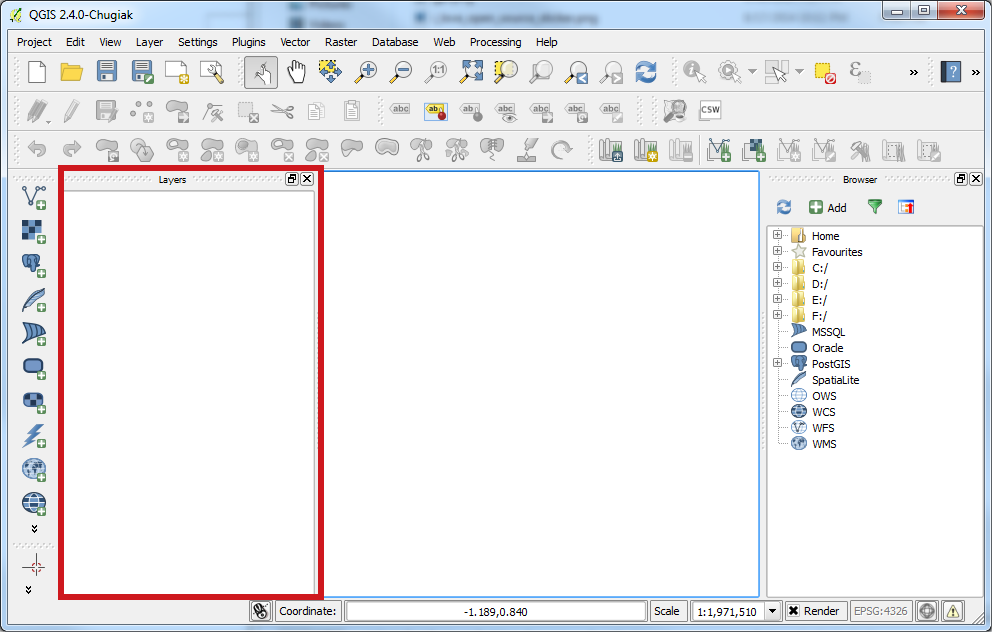
- Access and manage map layers
Browser Panel
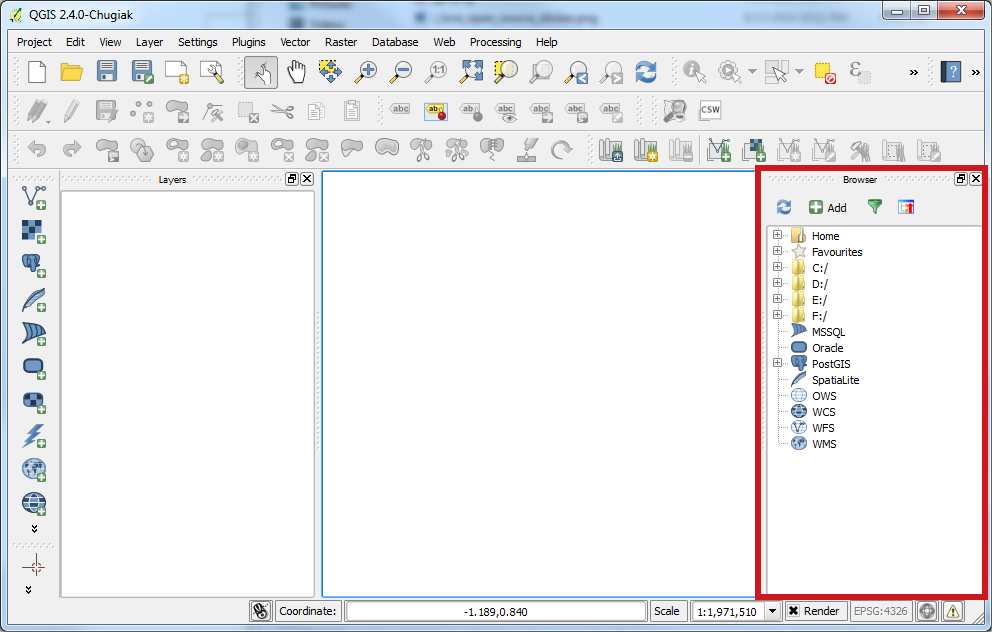
- Browse local and remote geospatial data.
Other Panels and More
OK enough of this intro stuff. Let’s dig in and make a map.
Let’s MAKE A MAP!
Introduction
Building on top of our previous meetups I figured that we could take a deeper look into the trail data that exists here in Central Oregon.
Let’s start first with downloading some City Limit data from the Oregon State Geospatial Clearinghouse. The Oregon State Geospatial Clearinghouse is a great resource for State level Geospatial data. Local County and City data can be accessed (sometimes for $) from Deschutes County and the City of Bend.

Bend City Limits Steps to Download Our First Dataset
- Go to the Spatial Data Library Alphalist
- Download the City Limits 2013 Polygon Shapefile
- Unzip the compressed file to your local machine - you should see several files which as a whole make up a Shapefile

Add the Shapefile to QGIS
- Launch QGIS
- Click the “Add Vector Layer” button from the Data Toolbar

- Navigate to where you downloaded the City Limits shapefile and select the .shp file.

- You should see a polygon GIS layer with boundaries of Oregon City limits.

OH AWESOME! Zoom in on this data. Click the identify tool. Explore your first dataset you have added to QGIS.
Changing Symbology for our City Limits Layer I am not sure about you but I am not a fan of the mauve color QGIS randomly selected for my City Limits. In fact I really only want an outline color and no fill pattern. Let’s explore changing the symbology for our City Limits layer.
- Double click or Right Click (you WindowZ peeps) on the “citylim_2013” layer in the Map Table of Contents. A Layer Properties Dialog should appear.

- Change the Symbol Layer Type to “Outline: Simple Line”. Pick a line color to fit the mood you are in.

- I am in the mood for a DASHED line pattern

- Press Apply. Your layer symbology should have changed. You should see the beautiful shape of Bend City Limits.

Congrats we now see the lovely shape of our fair city.
OpenStreetMap Trail Data
OK. Big deal I see the City of Bend. I thought we were going to access some trail data. U BETCHA!
As we learned in our previous meetup OpenStreetMap is a treasure trove of spatial data. There are many ways to extract. Today we will try using Overpass so that we can pull in .geojson data.
- Go to the Overpass website. Overpass is amazing. Lets dig deeper.
- I want to extract all lines (known in OSM as ways) that have been tagged as a bike path.
- Zoom to Bend.
- Enter the following text to the left panel
- Run the Query and Export a GEOJSON file

- Add the .geojson file that you downloaded to your computer to QGIS. Symbolize to your heart content.
NOTE: Looks like some of the data in OSM needs to better attributed.
Let’s Add Some Imagery
One of the AMAZING features of OSM are all the User Plugins available. Plugins add extra functionality to QGIS. To complete our map we need some imagery.
- Click on the Plugins menu > Manage Plugins
- Install the OpenLayers Plugin

- Close the Plugins Dialog. You should now have a new Toolbar name “Web”
- Choose to add Microsoft’s Bing Aerial Map

- You may need to drag and drop the layers in your Layer list to move the imagery to the bottom.
ZOMG - I AM A CARTOGRAPHER
OK…Let’s make a map.
- Position the map.
- Once positioned the way you want. Go to the Project menu and choose “New Print Composer”
- Give a name for your beautiful new print composition

- A whole new Application Window should appear with a Blank Paper Canvas. This is our MAP!!!

- Click on the “Add New Map” tool and drag a rectangle representing where you want to add a new map

- WOAH we have a map. Feel free to add a title, north arrow, legend and more!

CONGRATS
YOU just made your first QGIS Map

Special Thanks Thank you MapTimeBoston for your QGIS-101 tutorial Several images from this presentation are referenced in this lesson.